Interest Calculator
This Compound Interest Calculator can help determine the compound interest accumulation and final balances on both fixed principal amounts and additional periodic contributions. There are also optional factors available for consideration, such as the tax on interest income and inflation.
Accumulation Schedule
| Year | Deposit | Interest | Ending balance |
|---|---|---|---|
| 1 | $25,000.00 | $1,250.00 | $26,250.00 |
| 2 | $5,000.00 | $1,562.50 | $32,812.50 |
| 3 | $5,000.00 | $1,890.63 | $39,703.13 |
| 4 | $5,000.00 | $2,235.16 | $46,938.28 |
| 5 | $5,000.00 | $2,596.91 | $54,535.20 |
Interest is the compensation paid by the borrower to the lender for the use of money as a percent or an amount. The concept of interest is the backbone behind most financial instruments in the world.
There are two distinct methods of accumulating interest, categorized into simple interest or compound interest.
Simple Interest
The following is a basic example of how interest works. Derek would like to borrow $100 (usually called the principal) from the bank for one year. The bank wants 10% interest on it. To calculate interest:
$100 × 10% = $10
This interest is added to the principal, and the sum becomes Derek's required repayment to the bank one year later.
$100 + $10 = $110
Derek owes the bank $110 a year later, $100 for the principal and $10 as interest.
Let's assume that Derek wanted to borrow $100 for two years instead of one, and the bank calculates interest annually. He would simply be charged the interest rate twice, once at the end of each year.
$100 + $10(year 1) + $10(year 2) = $120
Derek owes the bank $120 two years later, $100 for the principal and $20 as interest.
The formula to calculate simple interest is:
interest = principal × interest rate × term
When more complicated frequencies of applying interest are involved, such as monthly or daily, use the formula:
| interest = principal × interest rate × |
|
However, simple interest is very seldom used in the real world. Even when people use the everyday word 'interest,' they are usually referring to interest that compounds.
Compound Interest
Compounding interest requires more than one period, so let's go back to the example of Derek borrowing $100 from the bank for two years at a 10% interest rate. For the first year, we calculate interest as usual.
$100 × 10% = $10
This interest is added to the principal, and the sum becomes Derek's required repayment to the bank for that present time.
$100 + $10 = $110
However, the year ends, and in comes another period. For compounding interest, rather than the original amount, the principal + any interest accumulated since is used. In Derek's case:
$110 × 10% = $11
Derek's interest charge at the end of year 2 is $11. This is added to what is owed after year 1:
$110 + $11 = $121
When the loan ends, the bank collects $121 from Derek instead of $120 if it were calculated using simple interest instead. This is because interest is also earned on interest.
The more frequently interest is compounded within a time period, the higher the interest will be earned on an original principal. The following is a graph showing just that, a $1,000 investment at various compounding frequencies earning 20% interest.
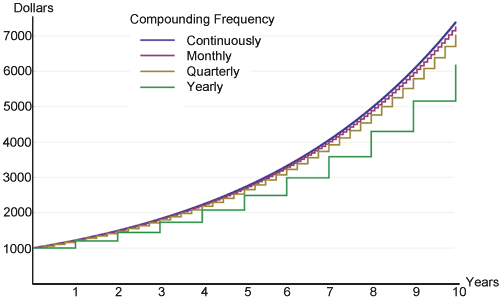
There is little difference during the beginning between all frequencies, but over time they slowly start to diverge. This is the power of compound interest everyone likes to talk about, illustrated in a concise graph. The continuous compound will always have the highest return due to its use of the mathematical limit of the frequency of compounding that can occur within a specified time period.
The Rule of 72
Anyone who wants to estimate compound interest in their head may find the rule of 72 very useful. Not for exact calculations as given by financial calculators, but to get ideas for ballpark figures. It states that in order to find the number of years (n) required to double a certain amount of money with any interest rate, simply divide 72 by that same rate.
Example: How long would it take to double $1,000 with an 8% interest rate?
| n = |
|
= 9 |
It will take 9 years for the $1,000 to become $2,000 at 8% interest. This formula works best for interest rates between 6 and 10%, but it should also work reasonably well for anything below 20%.
Fixed vs. Floating Interest Rate
The interest rate of a loan or savings can be "fixed" or "floating." Floating rate loans or savings are normally based on some reference rate, such as the U.S. Federal Reserve (Fed) funds rate or the LIBOR (London Interbank Offered Rate). Normally, the loan rate is a little higher, and the savings rate is a little lower than the reference rate. The difference goes to the profit of the bank. Both the Fed rate and LIBOR are short-term inter-bank interest rates, but the Fed rate is the main tool that the Federal Reserve uses to influence the supply of money in the U.S. economy. LIBOR is a commercial rate calculated from prevailing interest rates between highly credit-worthy institutions. Our Interest Calculator deals with fixed interest rates only.
Contributions
Our Interest Calculator above allows periodic deposits/contributions. This is useful for those who have the habit of saving a certain amount periodically. An important distinction to make regarding contributions is whether they occur at the beginning or end of compounding periods. Periodic payments that occur at the end have one less interest period total per contribution.
Tax Rate
Some forms of interest income are subject to taxes, including bonds, savings, and certificate of deposits(CDs). In the U.S., corporate bonds are almost always taxed. Certain types are fully taxed while others are partially taxed; for example, while interest earned on U.S. federal treasury bonds may be taxed at the federal level, they are generally exempt at the state and local level. Taxes can have very big impacts on the end balance. For example, if Derek saves $100 at 6% for 20 years, he will get:
$100 × (1 + 6%)20 = $320.71
This is tax-free. However, if Derek has a marginal tax rate of 25%, he will end up with $239.78 only because the tax rate of 25% applies to each compounding period.
Inflation Rate
Inflation is defined as a sustained increase in the prices of goods and services over time. As a result, a fixed amount of money will relatively afford less in the future. The average inflation rate in the U.S. in the past 100 years has hovered around 3%. As a tool of comparison, the average annual return rate of the S&P 500 (Standard & Poor's) index in the United States is around 10% in the same period. Please refer to our Inflation Calculator for more detailed information about inflation.
For our Interest Calculator, leave the inflation rate at 0 for quick, generalized results. But for real and accurate numbers, it is possible to input figures in order to account for inflation.
Tax and inflation combined make it hard to grow the real value of money. For example, in the United States, the middle class has a marginal tax rate of around 25%, and the average inflation rate is 3%. To maintain the value of the money, a stable interest rate or investment return rate of 4% or above needs to be earned, and this is not easy to achieve.